Client Demographics Report
One of the big questions for any service is “who are we serving?” Luckily, Clarity has a report designed to answer exactly that question. The [OUTS-106] Client Demographics Report is easy to use and even brings along some interesting data visualizations of its own.
The Client Demographics Report can be found in the Clarity Reports Library under “Program Based Reports.” You have multiple parameter options available including program type, program name, and veteran status. After selecting the parameters and date range you desire, click submit. Once your report is queued up it will take a minute before it is ready to open. The more clients it is pulling, the longer the report takes to prepare. Clarity will let you know when the report is ready.
Now it is time to open your report! This report has several charts and tables that breaks down different client demographics by the number of clients in each category that participated in the project(s) you identified in the parameters.
Most of the information in this report is pretty self-explanatory, but let’s see what kind of insights we can gain if we dig a little deeper. Here are a couple of charts from an example report:
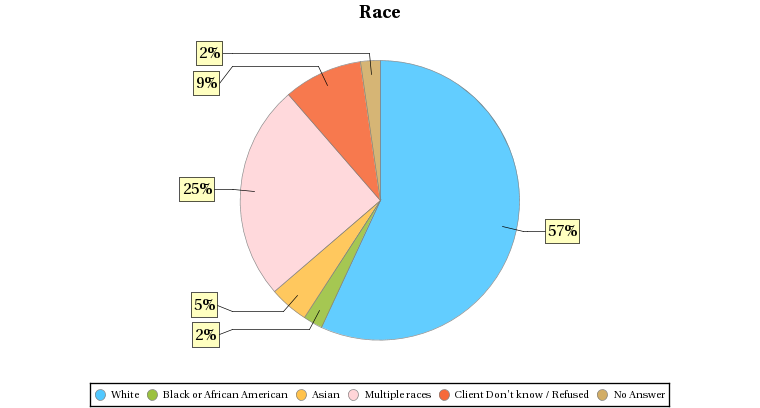
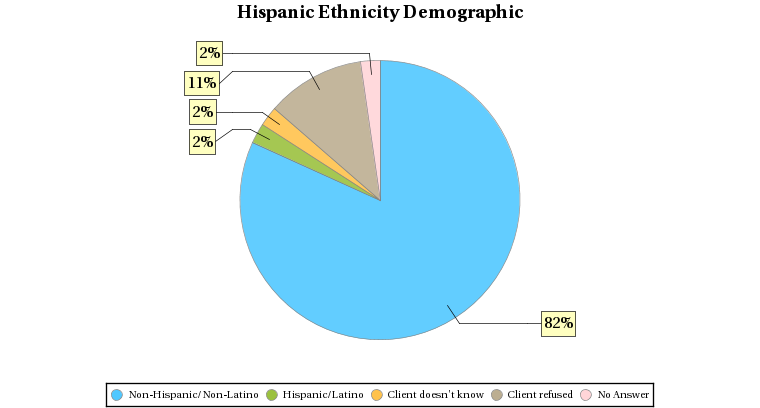
We can see that the majority of clients in this program are White and non-Hispanic/non-Latino. These measures alone don’t mean much, but what happens when we compare them to the most recent PIT data?
| White | 57% |
| Black or African-American | 21% |
| Asian | 2% |
| American Indian or Alaska Native | 8% |
| Native Hawaiian or Other Pacific Islander | 3% |
| Multiple Races | 8% |
| Non-Hispanic/Non-Latino | 86% |
| Hispanic/Latino | 14% |
If you said that people of color are being under represented in this project then you would be right! By looking at the community wide demographic data from the PIT you should notice that people identifying as Black or African-American make up a far larger percentage of the homeless population than those being served by this project. The same is true for the Hispanic/Latino population. This is an indicator that the marketing of the project isn’t reaching or connecting with certain cultural groups. There could be a number of reasons for this, but some of the things to address in this situation would be:
- Having materials available in multiple languages (at least Spanish and English).
- Canvasing or hanging fliers in areas frequented by diverse groups of people. Don’t just rely on your website and word of mouth, but try hanging materials at the grocery store, library, churches, colleges, or any other publicly visible areas.
- Implement diverse hiring practices to ensure your staff are as culturally diverse as the community you intend to serve. This can bring different strategies and perspectives into how you deliver services.
- Partner with local agencies that specialize in working with underrepresented groups.
Try this exercise with your own data. If you compare your client demographics to your own counties PIT data, then you might find some interesting results. It is a good way to ensure equitable services.
If we missed anything or you have additional questions, feel free to reach out to your HMIS Team at Commerce.
Happy reporting!