Puget Sound Mapping Project

Looking at Puget Sound growth patterns

Click on the map below to be connected to an interactive online version where you can explore the data and maps in greater detail. You can find out more information on data definitions, downloading data, and conducting analysis via the tutorial materials and drop down menus below.

Note: Click here for MASTER LAND USE CATEGORY DESCRIPTIONS
Note: Click here for the Color Template with details about the Puget Sound Mapping Project symbology

Click on this map to be connected to an interactive version

Using the maps and data

This link is to the dataset of land uses included n the Puget Sound Mapping Project.

Color Template 2018 with details about Puget Sound Mapping Project symbology.

City and county zoning classifications were assigned to one of 32 sub-categories based upon a matrix describing predominant land uses and attributes such as residential density, building heights, and impervious coverage. 

Click here for master category definitions. Click here for sub category definitions.


City and county zoning classifications were assigned to one of 32 sub-categories based upon a matrix describing predominant land uses and attributes such as residential density, building heights and impervious surface coverage. A translation table shows the specific assignments for each polygon and denotes the zoning designations by city and/or county.

We worked with the Washington State of Office of Financial Management’s Small Area Estimates Program to have existing and new housing units calculated for polygons. This data provides information on annual housing growth between 2001 and 2017.  This data also indicates the existing housing stock as of 2000.  Unit data is not differentiated by unit type (i.e. detached, apartment, mobile home, etc.).  The housing growth layer’s polygons have attribute fields that allow estimates to be summarized in a number of potential ways including by land-use categories, city, county, urban growth area and Watershed Characterization Assessment Unit. See tutorial information below for details on how to conduct these calculations.

Metadata that complies with the Federal Geographic Data Committee (ISO) 191xx standards was prepared for the land use layer and is available in PDF form.

An Excel table of housing estimates for each polygon provides the ability to summarize statistics by years, or groups of years, by a number of geographic boundaries. These boundaries include city/county name, urban/rural status, watershed analysis, and land use subcategory.

Within the table, the abbreviation “HU” indicates housing units as identified by the Washington State Office of Financial Management Small Area Population Estimates.

“HU_2000” indicates the number of housing units located within the polygon in 2000.  “HU_2001” indicates the number of housing units in 2001, and so on. Columns that contain fields listed as “NEW” mean the number of new units constructed between indicated dates, for example, “NEW_00_10” means units constructed between 2000 and 2010.  Similarly, columns headed by the abbreviation “PCT” means the percentage increase in the number of units over that period.  While the full name of the field does not show on the web display, it will be fully visible by maximizing column width after download.

Base units (those existing pre-2000) can be calculated by dividing the net new units by percentage change – for example if 1,500 new units occurred between 2000 and 2010 and the percentage change was 66.67 percent then the base units would be 2,250 (1,500/.6667 = 2,250).

“FID” represents the attribute table ID number.  “MASTER_CAT” and “SUB_CAT” correspond to the master and sub land-use category designations for that polygon while “SUB_CAT_1” shows polygons with active land uses (minus water, rights-of-way, undesignated, etc.).  The column entitled “URB” indicates the polygons location within a Growth Management Act designated urban area.  The “CITY_NM” column indicates the city, if applicable, and “NAME” provides the information on the county in which the polygon is located. “AUPolyID” provides the WRIA Watershed Characterization Project Assessment Unit number in which the Polygon is located.  The “LUCodeID” and “SubCID” fields correspond to polygon identification numbers contained in the attribute table for the housing unit map layers.

In addition to analyzing growth patterns within rural areas, watershed assessment units and land-use categories, there are numerous ways in which the Puget Sound Mapping Program’s map layers can help support a wide range of planning and environmental restoration efforts.

Downloadable Disclaimer

The Washington State Department of Commerce (Commerce) believes in the importance of the public’s right to know about its operations and activities. Commerce prepares and uses this data and information as a conceptual tool. GIS Data is intended to be used as a GUIDE. These maps were created from available public records and existing map sources, and from different surveyors and their surveys. Map features from all sources have been adjusted to achieve a ‘best fit’ registration to the Zoning of parcels. While great care was taken in this process, maps from different sources rarely agree as to the precise location of geographic features. The relative positioning of map features to one another results from combining different map sources without field ‘ground truthing’. This data and information may contain aggregate, anonymous statistics. This data and information should not be construed, express or implied, as legal advice or legal opinion on any specific facts or circumstances. Commerce discloses this data and information as-is without any warranty, and Commerce expressly disclaims all express or implied warranties of merchantability and fitness for a particular use. The burden for determining fitness for use lies entirely with the user. In no event shall the Commerce have any liability whatsoever for payment of any consequential, incidental, indirect, special, or tort damages of any kind, including, but not limited to, any loss of profits arising out of use of or reliance on the geographic data or arising out of the delivery, installation, operation, or support by Commerce. No public agency, public official, public employee, or custodian shall be liable, nor shall a cause of action exist, for any loss or damage based upon the release of a public record if the public agency, public official, public employee, or custodian acted in good faith in attempting to comply with the provisions of Washington’s Public Records Act. Commerce reserves the right to alter, suspend, re-host, or retire this service at any time and without notice. This service can be used in custom web applications and software products. Your use of this service in these types of tools forms a dependency on the service definition (available fields, layers, etc.). If you form any dependency on this service, be aware of a significant risk to your purposes. Consider mitigating your risk by extracting the source data and using it to host your own service in an environment under your control.

What are we seeing in growth patterns?

Growth rates slowed markedly during the recession and only recently started to match pre-recession rates. King County has captured almost half of the region’s new housing units between 2000 and 2017.  Snohomish and Pierce County have also seen high levels of growth. Within the region’s rural areas, growth has clustered within a few miles of the urban growth boundaries.

Increasing populations and development typically results in loss of vegetation and increased impervious surfaces (pavement and buildings). Increases in impervious surfaces reduces the amount of water that is naturally absorbed into the ground and reduces the amount of ground water available for drinking.  Impervious surfaces also increases run-off of contaminants like fertilizers and pesticides to rivers, lakes and the ocean, reducing the amount and quality of water that is available for people, aquatic life, and wildlife. Threats to water quality challenge our best efforts to reduce impacts of urbanization.

One of the Puget Sound Partnership’s Vital Sign recovery targets for 2020 is to focus at least 85% of regional growth within urban areas (and to protect rural areas by limiting rural development less than 15% of the overall total). As of 2017, the region is meeting this goal, with less than 10% of growth occurring in rural areas over the past few years.  However, recently, as growth continues to increase, development is starting to shift to rural areas, and some counties are experiencing rural development rates at or above the Puget Sound Target. Go here for line graph.

Dept. of Ecology’s Watershed Characterization Project designated approximately 3,000 “Watershed Characterization Assessment Units” (AUs) throughout the Puget Sound and evaluated these areas for their value for restoration and protection. Overall, our mapping indicates that these AUs saw the creation of 430,316 new housing units between 2000 and 2017; or an increase of just over 26%. Areas of high housing growth outside of urban growth boundaries are broadly associated with coastal plains near cities, within the valleys of the Cascade Mountains and near freeways, highways or major roadways. A map of growth within Ecology’s AUs shows a broad depiction of growth patterns.

In 2017, our region-wide mapping analysis indicates that most housing development within urban growth areas, has occurred primarily in Intensive Urban (12,748 units) and Urban Character Residential (6,276 units) land use categories.  In rural areas, the Rural Character Residential (1,589 units) land use category has experienced the most growth. Other land use categories accounted for 463 new units. Mixed Use and Commercial Area growth rates are increasing with 2017 rates exceeding the annual average rate from 2000-2017. In addition, Low Density Urban Residential (1.1-3 Units/Acre) areas also saw higher rates in 2017 than the long-term average annual rate. Click here to see a graph on the amount of growth happening in rural areas.

Most of the region’s urban growth is occurring in Seattle, Bellevue, Everett and Tacoma and their proportion of regional growth appears to be increasing. In addition, large master planned communities such as the Issaquah Highland, Snoqualmie Ridge and Redmond Ridge show intensive new housing growth. In the southern portions of the region, Joint Base Lewis-McChord (JBLM), Frederickson and Puyallup are experiencing the heaviest housing production. Mill Creek, Alderwood, Marysville, and Lake Stevens are more recent heavy growth counterparts on the northern end of the region. Whatcom, Skagit, Kitsap, and Thurston counties are also showing strong yearly increases in both rural and urban areas. In other counties, such as Clallam, Island, Jefferson, Mason, and San Juan, rural development is occurring at a rate similar to (or higher than) urban development levels.

One of the Puget Sound Partnership’s Vital Sign recovery targets for 2020 is to focus at least 85% of regional growth within urban areas (and to protect rural areas by limiting rural development less than 15% of the overall total). As of 2017, the region is meeting this goal, with less than 10% of growth occurring in rural areas over the past few years.  However, recently, as growth continues to increase, development is starting to shift to rural areas, and some counties are experiencing rural development at rates at or above the Puget Sound Target. Go here for line graph.

An Excel table of housing estimates for each polygon provides the ability to summarize statistics by years, or groups of years, by a number of geographic boundaries. These boundaries include city/county name, urban/rural status, watershed analysis, and land use subcategory.

Within the table, the abbreviation “HU” indicates housing units as identified by the Washington State Office of Financial Management Small Area Population Estimates.

“HU_2000” indicates the number of housing units located within the polygon in 2000.  “HU_2001” indicates the number of housing units in 2001, and so on. Columns that contain fields listed as “NEW” mean the number of new units constructed between indicated dates, for example, “NEW_00_10” means units constructed between 2000 and 2010.  Similarly, columns headed by the abbreviation “PCT” means the percentage increase in the number of units over that period.  While the full name of the field does not show on the web display, it will be fully visible by maximizing column width after download.

Base units (those existing pre-2000) can be calculated by dividing the net new units by percentage change – for example if 1,500 new units occurred between 2000 and 2010 and the percentage change was 66.67 percent then the base units would be 2,250 (1,500/.6667 = 2,250).

“FID” represents the attribute table ID number.  “MASTER_CAT” and “SUB_CAT” correspond to the master and sub land-use category designations for that polygon while “SUB_CAT_1” shows polygons with active land uses (minus water, rights-of-way, undesignated, etc.).  The column entitled “URB” indicates the polygons location within a Growth Management Act designated urban area.  The “CITY_NM” column indicates the city, if applicable, and “NAME” provides the information on the county in which the polygon is located. “AUPolyID” provides the WRIA Watershed Characterization Project Assessment Unit number in which the Polygon is located.  The “LUCodeID” and “SubCID” fields correspond to polygon identification numbers contained in the attribute table for the housing unit map layers.

Growth Patterns

The data prepared for the Puget Sound Mapping Project can help communities understand growth patterns and explore whether development is progressing as planned. Each jurisdiction will discover a unique pattern of development influenced by comprehensive plans as well as regional growth patterns.

In looking at the broad regional pattern of recent growth, it appears that development is occurring within urban areas and urban centers as planned by regional, county and city governments.

With that said, we can see that some areas are experiencing more pressure than are others.

While all counties have seen a drop in rural development rates happening after 2010, some rates of reduction are more pronounced than others.  For instance, Kitsap and Skagit counties both saw rural housing development rates decrease by 75% when comparing the 2001-2009 period with 2010-2017.

In terms of the gross number of units added in rural areas, Pierce, Snohomish and Thurston is increasing by over 200 units per year, with recent rural development in Snohomish and Pierce counties at over 300 units per year; indicating significant growth pressure in these locations.

Regional rural development appears to be happening close to the urban growth boundary with about half (47%) of the total amount occurring within two miles of the urban growth boundary. In addition, the Urban Edge sub-category (which contains low-density residential development ranging from one unit per acre up to one unit per 4.9 acres predominantly located in rural areas) is seeing growth occurring at a gross density of 167 units per square mile.  Rate of development in Urban Edge areas is over half (60%) of that seen in Urban Residential areas (which are zoned at significantly higher densities).  This may indicate disproportionate development pressure in these areas.

About 18 percent of all housing development since 2001, or 78,959 units, has occurred in rural areas. The land use categories that primarily correspond with rural areas that have seen significant development include the Active Open Space, Agricultural Areas, Forest Lands and Rural Residential Areas.  Rural Residential areas have predominantly accommodated rural growth with over 86 percent happening in these locations.  Active Open Space, Agricultural Areas, and Forest Lands saw 2,000 to 4,300 new housing units and accounted for an additional 12 percent of rural development.

Based upon estimates by the Washington State Office of Financial Management, it appears that almost 30 percent of single-family housing development occurred outside of Urban Residential land use categories. This seems to indicate that despite the reduction in growth within rural areas, a significant number of new single-family homes are not being developed in urban growth areas.

Within Urban Areas, growth split almost equally between Urban Residential (predominately single-family housing) and Intensive Urban Areas (predominately multi-family units).  The amount of growth in Intensive Urban areas is virtually equal with the increase in multi-family units estimated by the Washington State Office of Financial Management. As a result, it is unlikely that significant apartment development occurred in other categories.

Central urban centers such as Seattle, Bellevue and Tacoma are experiencing rapid growth.  Over half of growth within Intensive Urban Areas occurred in these cities. In Seattle, this rate of growth is accelerating with about 50% more development happening annually since 2010 (compared to annual rates between 2001 and 2009).  In Bellevue and Tacoma, however, annual development rates appear to have dropped since 2010.

Multi-family development, in general, appears to be highly concentrated within King, Pierce and Snohomish counties. These three counties accounted for 89 percent of new multi-family units within the Puget Sound Region.

Within Urban Residential areas, it appears that some areas are realizing density levels that are close to maximum ranges allowed by zoning. This appears to be especially true in locations where Master Planned Developments (MPDs), such as Issaquah Highlands and Redmond Ridge, have been recently built out.  In some areas, infill single-family development does not appear to be as robust as nearby locations.  There are multiple possible reasons why these growth rates vary by location and supplemental research is needed help determine which of these factors could be addressed through planning efforts.

There are some efforts underway already to dig deeper into the factors affecting regional growth patterns.  For instance, the Puget Sound Institute is beginning a research study to look at growth occurring near the urban growth boundary.  This study will help determine what may influence developers to build new units within or outside of urban growth areas.  Contingent upon funding, Commerce would like to assess the degree to which lack of sewer systems (or reliance upon septic systems) may be influencing location of new development.  The Puget Sound Regional Council has undertaken efforts such as the Housing Innovations Program to evaluate measures that could boost development in urban centers.

Each jurisdiction will likely be able to use the Puget Sound Mapping Project data to isolate unique questions about their development patterns that may deserve further investigation.  Commerce hopes that these maps and data could help cities and counties fine tune things such as zoning, capital facility plans and implementation measures to improve the correlation of growth with land use plans.

Tutorials on ways to use the data

Looking at regional housing development

The Puget Sound region has experienced substantial residential development since 2001.  The first map below shows new housing units built between 2001 through 2017.  The second map shows new units built between 2016 and 2017. The third map depicts cumulative development from pre-1900s to 2017.

Note: Click on the maps below for a larger version

New Housing Units 2001 - 2017

New Housing Units, 2017

Total Housing Units over Time (pre 1900 through 2017)

Land Use Sub-categories (2012)

Project Purpose

To provide a mapping tool for regional and local governments that shows growth patterns around the Puget Sound Region using consistent methods across cities and counties.

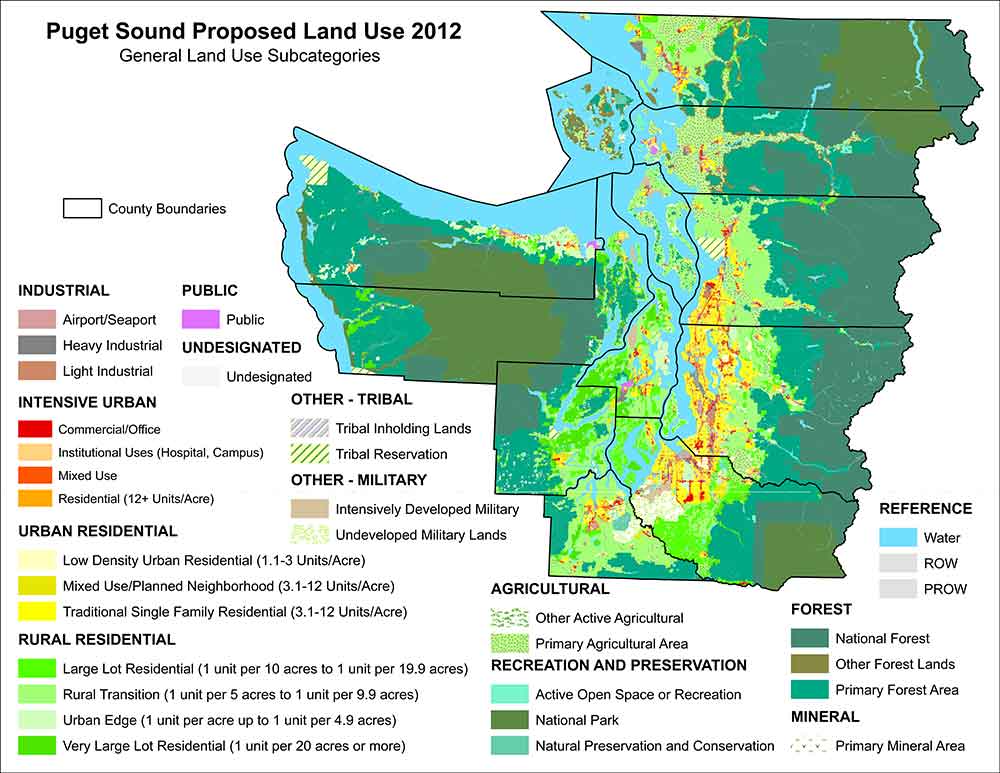
This interactive mapping tool allows decision makers to compare expected and actual development patterns over the landscape and across major land use categories (and subcategories) of land use zoning. Some of the ways the data and maps can be used is to:

 – Look at the acreage of land-uses by type within defined areas (neighborhoods, urban growth areas, watersheds, etc.)
 – Calculate the amount of housing development happening within defined areas or categories of land-use (i.e. urban residential areas, agricultural areas, etc.)
 – Analyze patterns of land-use and housing growth to understand if plans are working as intended or whether unintended impacts are happening in areas experiencing growth pressures.

The insights gained from these maps enables more data-driven decisions and can be integrated with resource agency maps to assist local governments with comprehensive planning.

Project Funding

This project has been funded by the United States Environmental Protection Agency (via agreement PC-00J27601 with the Washington State Department of Ecology). The contents of this web page and its documents do not necessarily reflect the views and policies of the Environmental Protection Agency, nor constitute any endorsement or recommendations.

Need information or see a technical problem with a map?

If the tutorials, slides and links don’t provide answers to your questions or you need to let us know about issues with the map(s) (such as incorrect categorization of a land use, error in boundaries, trouble with data display or downloading) please contact:

Tara Newman, Senior Planner
Growth Management Services
Tara.Newman@commerce.wa.gov 
Phone: 360-764-3414


Webinar: A Walk Through the Maps

Puget Sound Mapping Project Description (PDF)

Using the Maps: A Friendly Tutorial

Additional Information and Mapping Tools

Puget Sound Watershed Characterization Project Compares areas of Puget Sound basin in terms of sustainability and value for restoration and protection.  Provides information on individual watersheds in terms of:  water flow processes, water quality processes, and fish and wildlife habitats.
Coastal Atlas: Includes maps on flood hazard maps, shoreline biology, hydrography, spill response, shoreline modifications and the Shoreline Management Act jurisdictions as well as geomorphology.
Water Quality AtlasShows approved and in-development water quality improvement projects state-wide, water quality status for a particular location, and location of permitted outfalls.

High Resolution Change Detection Project: The High Resolution Change Detection project utilizes aerial imagery to detect changes in land cover within the Puget Sound regions. Information is also available here.
SalmonScape: This web application  displays a wide range of data related to salmon distribution, status, and habitats. The data sources used by SalmonScape include stream specific fish and habitat data, and information about stock status and recovery evaluations.
SCORE (Salmon Conservation and Reporting Engine): This WDFW application leads you to maps for different WRIAs and summarized data and information about salmon conservation for each WRIA.
StreamNet: Salmon GIS data and maps for the Pacific Northwest are also available.

Small Area Population Estimate (SAEP): Small Area Estimates Program (SAEP) estimates are meant to provide a consistent set of small area population and housing data for statewide applications. SAEP estimates are generated for census areas and other areas of statewide significance.